Page 7 - BrandZ Top 100 Most Valuable Global Brands 2014
P. 7
Section 01 | Highlights
Key Results
Key Results
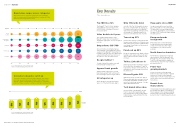
Brand value surges across categories
Brand value across categories surged this year, marking a The headlines
shift to solid growth following luctuations coming out of the
inancial crisis and global recession.
Top 100 rises 12%
Only 18 brands down
Huge gains since 2006
The BrandZM Top 100 Most Valuable Only 18 of the Top 100 brands lost value Google increased the most in dollar
Global Brands increased 12 percent, this year, compared with an average of value, $45.2 billion, in the 2014 ranking.
Top 100
100 111
134 135 141
165 166 177 198
to $2.9 trillion, following a 7 percent 30 brands each year since the BrandZM The brand also increased signiicantly
rise a year earlier.
Global Top 100 rankings started in 2006. since 2006, $121.4 billion, second only to
An average of 31 brands annually lost the gain of $131.9 billion by Apple during
Food 100 117
161 208 196
217 249 256 369
Value doubles in 8 years
value since the inancial crisis of 2008.
the same period.
& drink
Tencent up 97%
European brands
The combined brand value of the
Commodities BrandZM Global Top 100 has almost lead growth
& Logistics
100 97
113 102 201
221 264 266 342
doubled in eight years, since its inception Tencent, the Chinese social network and
in 2006.
Internet portal, led the list of fastest risers
with a 97 percent increase in brand value, Brands based in Continental Europe
increased 19 percent in brand value
Financial
100 142
166 133 146
172 155 195 269
Outperforms S&P 500
overtaking China Mobile as China’s most overall, more than any other region,
valuable brand.
following a rise of only 5 percent a
Since 2006, the stock market values
Facebook up 68%
year ago.
Technology
100 142
166 133 146
172 155 195 269
of the BrandZM Strong Brands Portfolio,
a subset of the BrandZM Global Top 100, North America dominates
has appreciated 81.1 percent, signiicantly Facebook (up 68 percent), Baidu, China’s
outperforming the 44.7 percent rise in leading search engine (46 percent) and
the S&P 500 over the same period.
Yahoo! (44 percent) also made the Top North America dominated in regional
Consumer
100 97
103 115 104
102 93 116 172
representation. Half the brands in the
20 Risers.
BrandZM Top 100 and two-thirds of the
Google number 1
Top 100 total brand value originate in
Twitter, LinkedIn are in
North America. All of the Top 10 brands
Google claimed the number one rank are based in the US.
06 07
08 09 10 11 12 13 14
in the BrandZM Global Top 100.
Twitter and LinkedIn entered the Top 100
for the irst time, at numbers 71 and 78, Fewer fast Source: Millward Brown Optimor, BrandZM data
Apparel leads growth
respectively. Amazon entered the Top 10 Index of annual brand value growth, 2006=100
growing markets
at number 10, the irst retailer to achieve
Apparel led all categories in overall this distinction.
Slower economies in fast growing
brand value growth with a 29 percent Microsoft gains 29%
markets reduced the number of brands
rise, following 21 percent a year earlier.
from those counties in the BrandZM Consumer categories catch up
Global Top 100, from 17 a year ago to 14,
All categories up
With Microsoft up several slots, after a
29 percent brand value increase, the top 11 from China, two from Russia and one Consumer categories, which includes apparel, cars, luxury,
four brands in BrandZM Global Top 100 from Africa.
personal care and retail, grew sharply in brand value in the
All 14 categories increased in brand BrandZM Global Top 100 2014, as spending rose following a
value, 10 of them with double-digits.
are in the technology category – Google, Brands from period of shaky consumer conidence and high unemployment.
Apple, IBM and Microsoft.
many nations
Tech brands drive value
Other brands from China and Russia, and
Around a ifth of the BrandZM Global also brands from Brazil, Colombia and
Top 100 are technology brands and Mexico appear in the category rankings, 200
Top 10
these 18 brands account for $827 billion which include some high-value brands
in brand value, nearly a third of the Top below the Top 100 brand value threshold.
100 total value.
100
Consumer
06 07 08 09 10 11 12 13 14
Source: Millward Brown Optimor, BrandZM data
Index of annual brand value growth, 2006=100
12 BrandZM Top 100 Most Valuable Global Brands 2014
13